Key Takeaways
Q4 brought the US Stock Market near historical highs.
Bond markets experienced its best quarter since 2001, with a return of 6.8%.
Inflation keeps moderating and reached 3.35% in December.
Resilient GDP growth in 2023 boosts chances for a soft landing.
Retirement account maximum contributions increase again for 2024.
Market review
As we leave 2023 behind, it’s encouraging to reflect on a year of resilience and recovery in the investment landscape. Following a historically bad return in 2022 across both stock and bond markets, last year turned out to be a great year for those investors who were able to stick to their long-term plans, accomplishment not taken lightly. The US stock market showcased several ups and downs throughout the year, delivering a remarkable 12%[1] in its last 4th quarter – the best of the year. With such a strong performance, many indices returned to their historical highs first seen in late 2021.
Despite facing many challenges like the banking sector crisis back in March, geopolitical tension, concerns about government shutdowns, several positive developments overweighed them all. Excitement around the advances in the AI technology, significant drop in inflation and surprisingly strong economy all contributed to a more positive outlook, boosting a chance for “soft landing” (reducing inflation without triggering a recession).
The best asset class of Q4 was this time Global Real Estate, returning an impressive 15%[2] , beating both US stocks at 12%[3] and International Developed stocks at 10%[4] . If not for this great surge, real estate could have been looking at another negative return throughout 2023. Conversely, the worst performer of the quarter was commodities with -4.6%[5] return, mainly because of lower energy prices.
Market Performance [Source: Quarterly Market Review – Fourth Quarter 2023 by Dimensional Fund Advisors] [6]
The bond market, despite trailing stocks, experienced its best quarter since 2001, with a return of 6.8%[7]. The yield on US Treasury bonds dropped across all the maturities and closed the year at just 3.88%[8] (10 year), after peaking at almost 5%[9] in October. Within our most commonly used securities, Schwab Short Term US Treasury ETF (SCHO) stands out in the last quarter of 2023 as the one with the most extraordinary return (based on Z-Score). SCHO returned 2.54% this quarter, which is a great return for all the conservative accounts that rely heavily on this security within their portfolios. Although a 2.54% return is not unusual for a stock market or bonds with longer duration, it is very unusual for this conservative short-term bond fund, that historically (since 10/01/2010) returned only 0.22%[10] quarterly, with a 0.80%[11] standard deviation for a normalized return range of -1.4% to 1.8%.
Economy
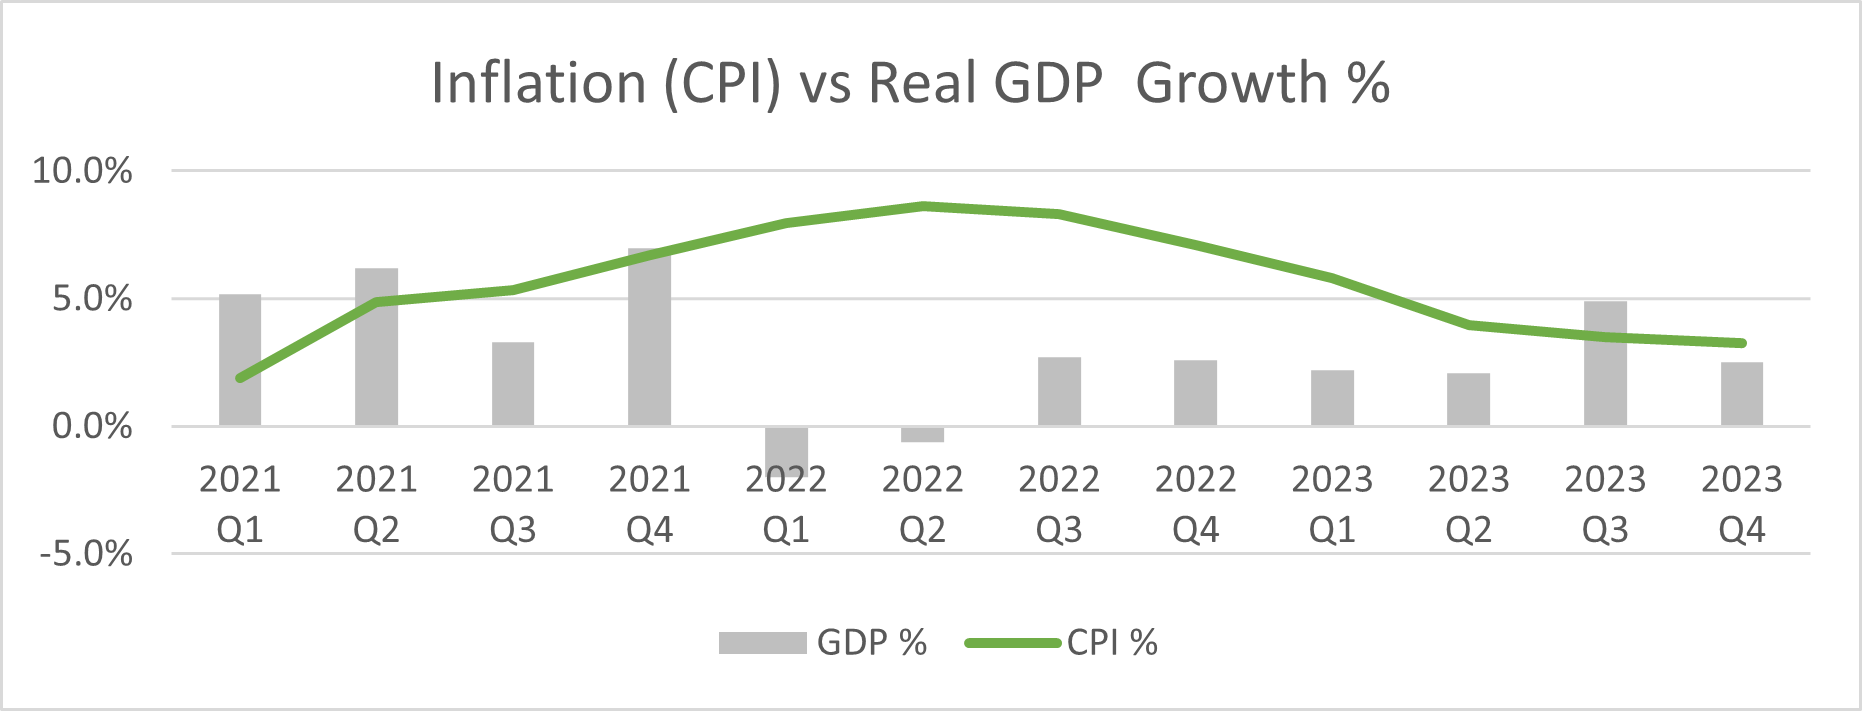
The economy sustained a remarkably healthy growth rate in 2023, ranging from 2.1%[12] in Q2, up to 4.9%[13] in Q3, defying many forecasts. As it started to be evident that inflation peaked back in 2022, and that the drop to 3-4% range in early 2023 was likely to hold steady, the Federal Reserve decided to pause its aggressive rate hikes and kept them steady at 5.25%-5.5% range in the second half of 2023. As of December, the inflation stood at 3.35%[14] and GDP growth is expected to reach 2.5%[15].
CPI and GDP[16] - CPI as 3 Month Average; 2023 Q4 GDP estimate by GDPNow.
Looking back over the past few years gives a valuable insight into our current economic landscape. Coming out of the pandemic, we saw a surge in demand alongside disruptions in supply and a massive fiscal and monetary stimulus. This combination overheated the economy (moving economy to the right top of the chart seen below) and drove up the prices and GDP growth above sustainable levels. To return to a healthy economy, it was necessary to moderate the demand. With lower demand on their mind, the Federal Reserve (and many other central banks around the world) decided to increase interest rates to a restrictive level (holding the economy back). As these high interest rates started to affect borrowing costs from housing, cars, to new manufacturing equipment, the economy and inflation started to moderate.
Economy in different Inflation and Real GDP Growth Rate regimes.
While avoiding GDP contraction in 2022 and 2023, risks of recession and stagflation were high as we were trying to return to healthy and sustainable economy. Looking ahead to 2024, the focus has shifted to achieving a soft lending. Many economists and market participants expect the Federal Reserve to ease restrictive monetary policy and start lowering interest rates, to avoid slowing down the economy too much, now that the inflation improved. Future rate cuts will depend on several factors, mainly inflation trends, but potentially on unemployment rates, given the Federal Reserve’s second mandate for maximum sustainable employment. Although, jobs growth slowed down in 2023, with December unemployment rate only at 3.7%[17] the labor market is still strong and does not require Federal Reserve to intervene to stimulate its growth.
The Dual Mandate Bullseye [Source: https://www.chicagofed.org/research/dual-mandate/dual-mandate]
Increased Retirement Accounts
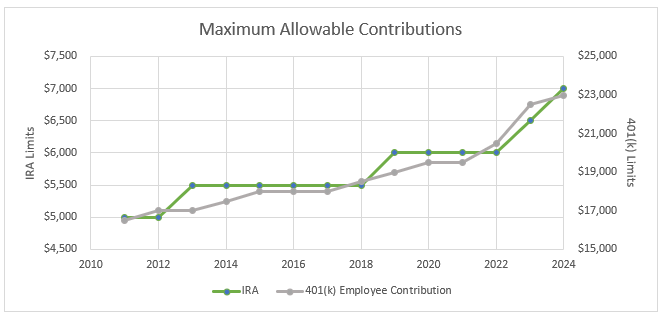
There are many different avenues and vehicles you can use for saving and investing for your future, whether that is after-tax vehicles like Roth IRA’s and Roth 401(k)s, or pre-tax vehicles like Traditional IRA’s, 401(k)’s, or 403(b)’s. Each of these retirement accounts have maximum contribution limits that are important to be aware of. As a result of inflation, the IRS raised the maximum allowable contributions of retirement accounts. Most retirement account limits are cost-of-living adjusted, so as inflation goes up, the limits should go up as well. Maximum allowable contributions into 401(k)’s went from $22,500 in 2023 to $23,000 in 2024. Looking at IRA’s (Roth and Traditional), their maximum allowable contribution increased to $7,000 from $6,500 for individuals under 50.
There are a few nuances that could be prominent to your situation when thinking about saving into these different accounts, like catch-up contributions and household income. If you would like to see how you are saving, and if these changes could impact you, please give Noah Hoekstra a call at 616-566-6443. He would love to go over the opportunities that present themselves to you in 2024 to save more and build for the future.
Closing Paragraph
As we review the economic landscape of the fourth quarter of 2023, it's important to keep a balanced perspective. The market has seen a mix of performances across different asset classes. Some have shown remarkable resilience and growth, while others have faced challenges. However, this diversity in performance is a natural part of the investment journey.
Moreover, while we have experienced inflation higher than the 2% target from the Federal Reserve, it's encouraging to see that GDP growth rates have remained steady. This indicates a level of underlying economic stability, which is a positive sign for long-term growth.
Given these insights, we strongly believe that maintaining our carefully crafted financial plan is the best course of action. The current economic conditions reaffirm the importance of staying committed to our strategies, which are designed to navigate through various market cycles and leverage opportunities for growth.
As always, our team is diligently monitoring the market to ensure that your portfolio is well positioned to adapt to any changes. Your financial goals remain our top priority, and we're here to support you every step of the way. Remember, staying the course is often the key to achieving long-term investment success. If your financial goals have changed or your financial plan needs some tweaking, please don’t hesitate to reach out to the VanderPol Investments team.
Authors: Noah Hoekstra, Richard Toth, CFA, CAIA and Mark VanderPol, CFP®
References
[1-5] Source: Quarterly Market Review – Fourth Quarter 2023 by Dimensional Fund Advisors
[6] US Stock Market (Russell 3000 Index), International Developed Stocks (MSCI World ex USA Index [net dividends]), Emerging Markets (MSCI Emerging Markets Index [net dividends]),Global Real Estate (S&P Global REIT Index [net dividends]), Commodities (The Bloomberg Commodity Total Return Index), US Bond Market (Bloomberg US Aggregate Bond Index), Global Bond Market ex US (Bloomberg Global Aggregate ex-USD Bond Index [hedged to USD])
[7-8] Source: Quarterly Market Review – Fourth Quarter 2023 by Dimensional Fund Advisors
[9] Source: https://www.cnbc.com/quotes/US10Y
[10-11] Morningstar
[12-13] Source: Bureau of Economic Analysis
[14] Source: U.S. Bureau of Labor Statistics
[15] Source: Federal Reserve Bank of Atlanta’s GDPNow as of 1/9/2024
[16] Sources: Federal Reserve Bank of Atlanta’s GDPNow as of 1/9/2024; Federal Reserve Bank of Cleveland; Bureau of Economic Analysis
[17] Source: Bureau of Labor Statistics
Disclosures
VanderPol Investments, LLC (“VPI”) is a registered investment adviser located in Michigan. VPI may only transact business in those states in which it is registered, or qualifies for an exemption or exclusion from registration requirements.
This presentation is limited to the dissemination of general information regarding VPI’s investment advisory services. Accordingly, the information in this presentation should not be construed, in any manner whatsoever, as a substitute for personalized individual advice from VPI. Information presented is for educational purposes only and does not intend to make an offer or solicitation for the sale or purchase of any specific securities, investments, or investment strategies. Investments involve risk and unless otherwise stated, are not guaranteed. Be sure to first consult with a qualified financial adviser and/or tax professional before implementing any strategy discussed herein. Any client examples were hypothetical and used to demonstrate a concept.
Past performance is not indicative of future performance. Therefore, no current or prospective client should assume that future performance of any specific investment, investment strategy (including the investments and/or investment strategies recommended by VPI), or product referenced directly or indirectly in this presentation, will be profitable. Different types of investments involve varying degrees of risk, & there can be no assurance that any specific investment or investment strategy will suitable for a client’s or prospective client’s investment portfolio.
Various indexes were chosen that are generally recognized as indicators or representation of the stock market in general. Indices are typically not available for direct investment, are unmanaged and do not include fees or expenses. Some indices may also not reflect reinvestment of dividends.
VPI may discuss and display, charts, graphs, formulas which are not intended to be used by themselves to determine which securities to buy or sell, or when to buy or sell them. Such charts and graphs offer limited information and should not be used on their own to make investment decisions.


