Key Takeaways
US markets reached a new all-time high, driven by large companies like Nvidia.
Gold added to its good performance from the first quarter, while real estate continued to struggle.
Bond yields saw a small increase in US, while Europe and Canada saw its first interest rate cuts.
Inflation returned to making progress, with core inflation reaching lowest levels since 2021.
With labor and inflation cooling off, the rate cuts in September are back on the table.
Market review
With another good quarter behind us, stock markets continue to reward patient investors with new all-time highs. After an initial 5% drop in April, sentiment improved as investors digested new data and inflation worries subsided. The US market gained 3.22% in the second quarter and increased an impressive 23% over the past 12 months. International markets showed divergence: developed countries lost 0.6%, while emerging markets led by countries like Turkey and Taiwan gained 5%, outperforming even the United States.
Market Performance [Source: Quarterly Market Review – Second Quarter 2024 by Dimensional Fund Advisors] [1]
Within US stocks, Large Growth continued its dominance with 8.33%[2] return in Q2, making it 33% for the past 12 months. Driven by popular companies like the leading AI chips manufacturer NVDA which saw its value grow 150%[3] in just the first 6 months of this year, it’s easy to see why. NVIDIA’s stock has surged due to the growth and adoption of large language models (LLMs) and the potential of its Omniverse platform. The demand for NVIDIA’s GPUs, essential for Artificial Intelligence (AI) applications, has driven the revenue growth to new levels. The Omniverse, aiming to revolutionize industries like gaming and design, represents a significant bet on future technologies, adding an element of risk but also substantial potential. Small cap companies lost 3.28%[4] in Q2 and gained only 10% over the past year, compared to large companies' 24% growth. As smaller companies often face higher relative costs for bonds and increased borrowing costs due to rising interest rates, they can have harder time competing against larger firms that often enjoy economies of scale, issuing bonds more cheaply and efficiently.
The worst performing asset was again real estate, with a 1.48%[5] loss in Q2, and just 0.6% annual growth over the past 5 years. High interest rates have depressed valuations across the real estate sector, but anticipated rate cuts might bring much needed relief.
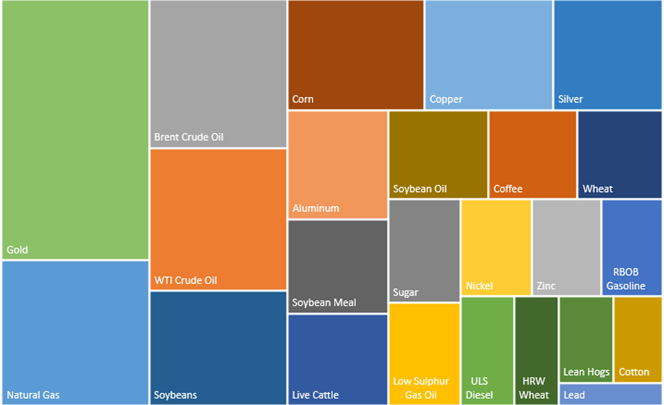
Commodities as a group returned 2.8%[6], led by coffee (20%), silver (16%), and copper (8%) while negative returns in energy commodities offset some gains. Gold, the largest single holding of the group, added 3.5% to its already strong 5.9%[7] performance from Q1.
2024 Target weights for the Bloomberg Commodity Index[8]
After a sharp drop in bond values back in April when the market was bracing for stubbornly high inflation, we saw a quick recovery resulting in a 0.07%[9] gain in US bonds for the full quarter. International bonds were not far off, gaining 0.11%. US yields increased across most maturities, with the biggest increase of 0.185%[10] in 30-year treasuries. Outside of the US, yields mostly increased, except for short-term rates in Germany and Canada, due to rate cuts in June by their respective central banks.
Our best-performing fund of the quarter at 5.81%[11] was Dimensional Emerging Core Equity Market ETF (DFAE), investing in companies from emerging countries like China or India. The worst performer was Vanguard Extended Duration Treasury Index Fund ETF (EDV), as yield increase in long-dated bonds pushed down the fund's value. While big swings in long-dated bonds or stocks are not uncommon, comparing the second quarter to historical averages, some unusual movers stand out. The biggest outlier[12] for this quarter was a 0-5 Year TIPS Bond ETF, ticker symbol STIP, for conservative orientated investors, with a return of 1.48%[13], more than double its average 0.69% quarterly return.
Economy
As was the case in the first quarter, the economy continues to slow down as high interest rates intended to cool down the overheated economy take effect. The real GDP growth in the first quarter was only 1.4%[14], the smallest gain since the -0.6% decline in Q2 of 2022. This smaller growth was driven mainly by a slowdown in private goods, which decreased 1.1%[15], the first decline since Q1 of 2023 when the Private Goods experienced a similar faith. Productivity grew, though at a slower pace of 0.2%. For the second quarter, the most recent estimate by Atlanta Fed GDPNow is 2%[16] real GDP growth.
The good news came on the inflation front when following a few months of growth in Q1, we returned to progress in Q2. The latest number for June shows only a 3%[17] increase compared to last year, the smallest growth in the past 12 months and the first negative 0.1% month-to-month change since 2020. Core inflation dropped to 3.3%[18], lowest level since May 2021. While helped by a large -10%[19] drop in used car prices, we also saw a meaningful slowdown in the index’ largest category, the shelter.
The labor market reflects the toll of higher interest rates too. Job openings, which skyrocketed to more than 12 million[20] in 2022, fell to 8.1 million in May, not too off from the pre Covid levels. With fewer job openings, adding new jobs to the economy is slowing down too. Most recently, the rolling 3-month average for the new jobs dropped significantly from 267,000[21] in Q1 to only 177,000 in Q2. Although this level of job creation is still good from a historical perspective, the trend and sudden slowdown could be concerning if it persists. Overall, the unemployment rate ticked up to 4.1%[22] .
Job Openings [Chart by: FRED®, Federal Reserve Bank of St. Louis]
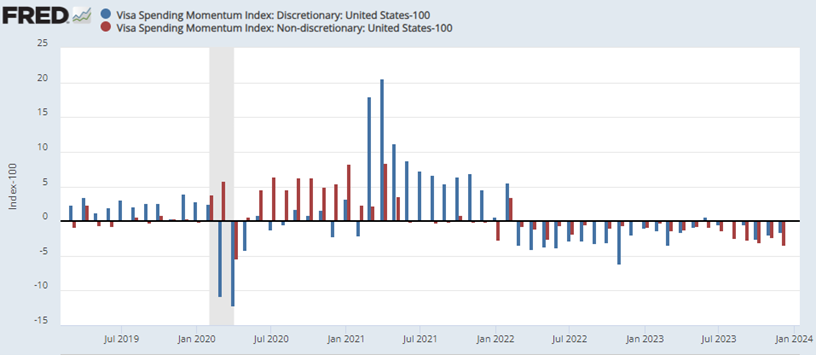
An interesting insight into how things like interest rates, job availability, and the economy affects us, the consumers, can be seen in the Visa Spending Momentum Index[23]. After the big increase in spending in late 2020 and 2021, we have seen negative change since March of 2022, the same month when Fed started increasing the rates.
Visa Spending Momentum Index [Chart by: FRED®, Federal Reserve Bank of St. Louis]
With the recent trends in inflation, unemployment, and the overall economy pointing towards an economy that is no longer overheated, a less tight monetary policy might be beneficial. Market expectations for future interest rates have adjusted lately too, with CME FedWatch giving 85%[24] probability of a rate cut in September.
Worried about all-time-highs?
With stock markets at an all-time high, some might worry about the possibility of a sharp fall, especially with attention-grabbing articles spreading panic regarding elections, deficits and others. But does a new all-time high suggest that stock markets will suddenly drop? According to DFA[25], the average weekly return following new highs is 0.26%, even higher than the 0.22% average for the entire period since 1926. While not surprising, new all-time highs are expected if we anticipate positive long-term returns. Are you still nervous about the markets or your finances? We are more than happy to review your situation and see if any adjustments could be beneficial for your specific situation.
Authors: Richard Toth, CFA, CAIA
References
[1] US Stock Market (Russell 3000 Index), International Developed Stocks (MSCI World ex USA Index [net dividends]), Emerging Markets (MSCI Emerging Markets Index [net dividends]),Global Real Estate (S&P Global REIT Index [net dividends]), Commodities (The Bloomberg Commodity Total Return Index), US Bond Market (Bloomberg US Aggregate Bond Index), Global Bond Market ex US (Bloomberg Global Aggregate ex-USD Bond Index [hedged to USD])
[2] Source: Quarterly Market Review – Second Quarter 2024 by Dimensional Fund Advisors
[3] Source: Morningstar Office
[4 -6] Source: Quarterly Market Review – Second Quarter 2024 by Dimensional Fund Advisors
[7] Source: Quarterly Market Review – First Quarter 2024 by Dimensional Fund Advisors
[8] Source: https://www.bloomberg.com/company/press/bloomberg-commodity-index-2024-target-weights-announced/
[9 - 10] Source: Quarterly Market Review – Second Quarter 2024 by Dimensional Fund Advisors
[11] Source: Morningstar Office
[12] Based on Z-Score
[13] Source: Morningstar Office
[14-15] Source: U.S. Bureau of Economic Analysis
[16] Federal Reserve Bank of Atlanta’s GDPNow as of 7/10/2024
[17 - 19] Source: U.S. Bureau of Labor Statistics
[20] Source: FRED, Federal Reserve Bank of St. Louis
[21-22] Source: U.S. Bureau of Labor Statistics
[23] Source: FRED, Federal Reserve Bank of St. Louis
[24] Source: https://www.cmegroup.com/markets/interest-rates/cme-fedwatch-tool.html as of 7/11/2024
[25] Source: Dimensional Fund Advisors; Index Description: Fama/French Total US Market Research Index: July 1926–present: Fama/French Total US Market Research Factor + One-Month US Treasury Bills.
Disclosures
VanderPol Investments, LLC (“VPI”) is a registered investment adviser located in Michigan. VPI may only transact business in those states in which it is registered, or qualifies for an exemption or exclusion from registration requirements.
This presentation is limited to the dissemination of general information regarding VPI’s investment advisory services. Accordingly, the information in this presentation should not be construed, in any manner whatsoever, as a substitute for personalized individual advice from VPI. Information presented is for educational purposes only and does not intend to make an offer or solicitation for the sale or purchase of any specific securities, investments, or investment strategies. Investments involve risk and unless otherwise stated, are not guaranteed. Be sure to first consult with a qualified financial adviser and/or tax professional before implementing any strategy discussed herein. Any client examples were hypothetical and used to demonstrate a concept.
Past performance is not indicative of future performance. Therefore, no current or prospective client should assume that future performance of any specific investment, investment strategy (including the investments and/or investment strategies recommended by VPI), or product referenced directly or indirectly in this presentation, will be profitable. Different types of investments involve varying degrees of risk, & there can be no assurance that any specific investment or investment strategy will suitable for a client’s or prospective client’s investment portfolio.
Various indexes were chosen that are generally recognized as indicators or representation of the stock market in general. Indices are typically not available for direct investment, are unmanaged and do not include fees or expenses. Some indices may also not reflect reinvestment of dividends.
VPI may discuss and display, charts, graphs, formulas which are not intended to be used by themselves to determine which securities to buy or sell, or when to buy or sell them. Such charts and graphs offer limited information and should not be used on their own to make investment decisions.


